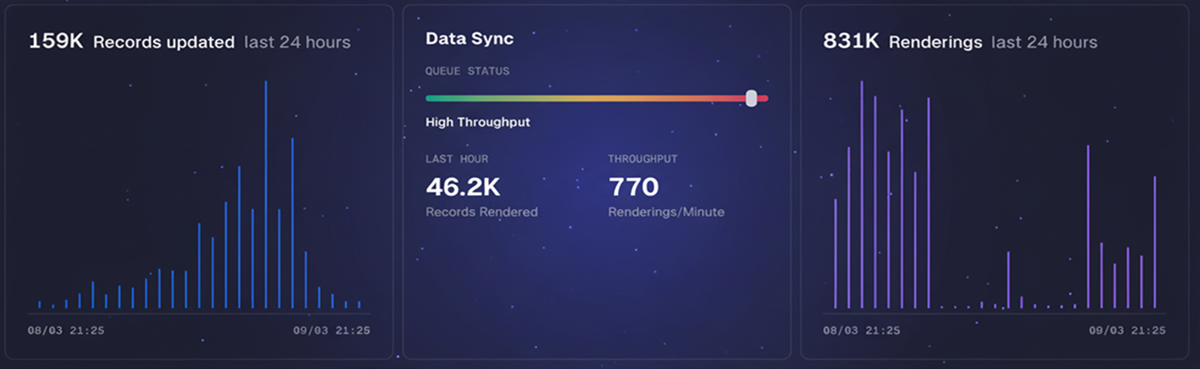
The admin dashboard has been completely redesigned to give you a real-time view of your data operations. Charts now show live activity for records processed, active transformations, and sync throughput, while dedicated widgets surface active integrations, in-progress work, and recent errors — all in one place the moment you log in.
- Records and transformation activity shown in interactive bar and area charts
- DataSync widget displays throughput rate and live queue pressure
- Active integrations and project shortcuts accessible directly from the dashboard
- Errors widget surfaces the last 24 hours of notifications so issues are immediately visible